Map Project
Methodology Behind The Map
By Cameron Flann, Dylan Katz, Kyle Colley, Luke Stetler, and Zack Wood
This all started with a compass and a blank sheet of paper. We began by starting at the orange rock in the lower right corner, with an angle pointing towards green rock. We then proceeded to write the bearing down on a sheet of paper. We repeated this process multiple times until we had all sides of the roughly rectangular area in which we were instructed to chart. Between bearing measurements, we counted our steps in as equal a manner as possible to get a rough distance. We rescaled our paces to two millimeters per pace and used a protractor to convert our bearings into angles on the paper. Google Earth allowed us to view where the contour lines should land. Contour lines are basically a way to portray elevation on a map. The closer they are together, the steeper the terrain. This is why a topographic map is useful, it allows you to get an idea of elevation from a map view. We used spatial awareness to find the high points and map the trail. We were required to be very conscious of all of our surroundings. This project has been the most outdoors related project this year, and was very enjoyable for all of us.

Rocket Project
September 25th, 2013
Entry 1 - Day 6
Today we will sand down the glue that attaches the parachute strings to the rocket. This way the rocket will deploy more easily and smoothly.
September 26th, 2013
Entry 2 - Day 7
Launch day, rocket went really high. Parachute didn’t deploy.
September 27th, 2013
Entry 3 - Day 8
Cut out a smaller parachute to attach to the bigger parachute so that the smaller one can pull the bigger one out.
October 1st, 2013
Entry 4 - Day 9
Test launch, everyone launched. Attached strings from the small parachute to the bigger parachute. Despite our efforts, still didn’t work.
October 2nd, 2013
Entry 5 - Day 10
Put the nose cone string through the small parachute. Taped it so it would stay put, threw rocket off of the hill behind our school to see if it works. Finally after days and days of work the parachute worked.
October 8th, 2013
Entry 6 - Day 11
We attached the plastic wings to the side of the rocket that will pop off the nose cone when the rocket starts its descent. Didn’t work, so we tore them off. Sad day
October 9th 2013
Entry 7 - Day 12
Weighed the Rocket 2.38 N
Measured the Rocket 72cm
Test launch
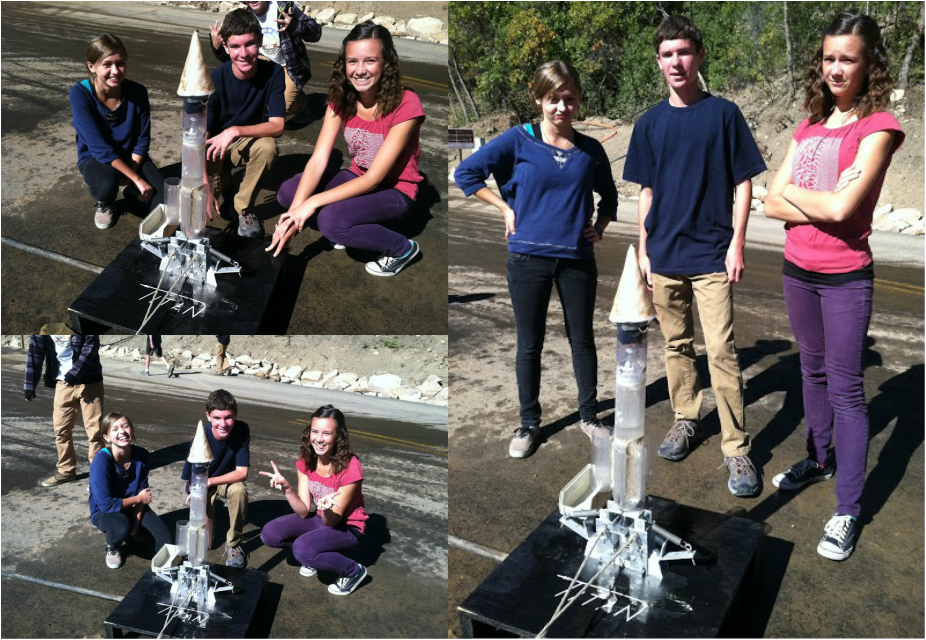
Rocket Reflection
By Luke Stetler
For the past month, in our physics class we have been working on a project where we had to build a water powered rocket. I was very happy with how the rocket turned out, even though it did not work as well as it should have at the exhibition. If I could go back and re-do the project I would first, pick different bottles to do it with. I think the bottles that we picked were not strong enough to hold the pressure that we expected it to hold. WIth the different bottles, it would have been easier to hold the pressure and we could have put more pressure in the pressure chamber.
During next years projects I feel like I could advise many things. The 2 major things that I would advise is to make their rocket at least 3 bottles long and spend somewhere around half of the time working on the parachute. If the parachute doesn’t deploy, then you are out of the contest. So if I could do it again I would spend a lot of time working on making that parachute deploy every single time.
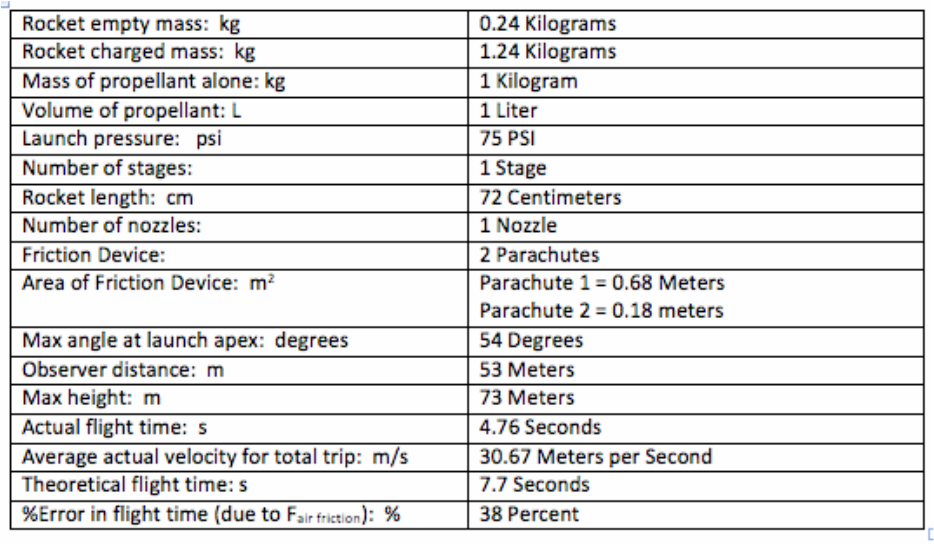
Rocket Conclusion:
At our rocket exhibition this year our rocket’s angle was at fifty-four degrees making the maximum height seventy three meters, and the observation table was fifty-three meters away from the launch pad. To calculate the maximum height, we multiplied the distance in meters from the observation table to the launch pad by the tangent function of our rocket’s flight angle. In order to calculate our rocket’s average velocity we multiply the maximum height by two then divided it by the actual flight time(4.76 s). This gave us our average velocity of 30.6 s. The flight time of our rocket was 4.76 s and the theoretical time was 7.7 s. We calculated the theoretical flight time by dividing the maximum height by the (Earth's acceleration multiplied by 0.5). Then you find the square root if that number and multiply it by two. This will give you the theoretical flight time. Next we had to calculate the percent error for hang time. This means how far off your hang time was versus your angle. You found this by taking the actual hang time and subtracting the theoretical hang time. Then you divide that by the theoretical hang time, this gave us 0.38. Then you multiply that by one-hundred and that gives you a percent. In our case that was thirty-eight percent. This thirty-eight percent error, means that our angle was pretty far off compared to the actual height of our rocket. This means that when our rocket was launched it went towards the recording table which made our angle higher than it actually went.
At our rocket exhibition this year our rocket’s angle was at fifty-four degrees making the maximum height seventy three meters, and the observation table was fifty-three meters away from the launch pad. To calculate the maximum height, we multiplied the distance in meters from the observation table to the launch pad by the tangent function of our rocket’s flight angle. In order to calculate our rocket’s average velocity we multiply the maximum height by two then divided it by the actual flight time(4.76 s). This gave us our average velocity of 30.6 s. The flight time of our rocket was 4.76 s and the theoretical time was 7.7 s. We calculated the theoretical flight time by dividing the maximum height by the (Earth's acceleration multiplied by 0.5). Then you find the square root if that number and multiply it by two. This will give you the theoretical flight time. Next we had to calculate the percent error for hang time. This means how far off your hang time was versus your angle. You found this by taking the actual hang time and subtracting the theoretical hang time. Then you divide that by the theoretical hang time, this gave us 0.38. Then you multiply that by one-hundred and that gives you a percent. In our case that was thirty-eight percent. This thirty-eight percent error, means that our angle was pretty far off compared to the actual height of our rocket. This means that when our rocket was launched it went towards the recording table which made our angle higher than it actually went.
